$n$ ways of looking at linear regression ($n$=1)
From a geometrical view point
Problem Setup
Suppose that we want to predict salary based on age, education, gender, job, etc, the common way to set up this problem is to represent the $n$ data points with $m$ features as a matrix:
$$ X = \begin{pmatrix} x_{1,1} & x_{1,2} & \cdots & x_{1,m} \\ x_{2,1} & x_{2,2} & \cdots & x_{2,m} \\ \vdots & \vdots & \ddots & \vdots \\ x_{n,1} & x_{n,2} & \cdots & x_{n,m} \end{pmatrix} $$where $x_{i,1}, x_{i,2}, x_{i,3}, ...$ could be the age, education, job and other features for the $i$-person.
We could also represent the salaries for each person as a vector:
$$ y = \begin{pmatrix} y_1 \\ y_2 \\ \vdots \\ y_n \end{pmatrix} $$Thus linear regression can be thought of finding another vector
$$ \beta = \begin{pmatrix} \beta_1 \\ \beta_2 \\ \vdots \\ \beta_m \end{pmatrix} $$such that $$ X\beta \approx y $$
We shall define the approximation $\approx$ rigorously later.

Example 2: Suppose that
$$ X= \begin{pmatrix} 1 & 4\\ 2 & 5 \\ 3 & 6 \end{pmatrix} $$then set $\{Xu| u \in \mathbb{R}^2\}$ is a plane

In general, the set $\{Xu| u \in \mathbb{R}^m\}$ is a hyperplane. So if $y$ is on the hyperplane, then by definition there is a $\beta \in \mathbb{R}^m$ that can satisfy the equation $X\beta=y$.
Now suppose $y$ is not on the hyperplane, next best thing we can do is to find a $\hat{y}$ on the hyperplabe that is closest to $y$, which is the orthogonal projection of $y$ onto the plane .
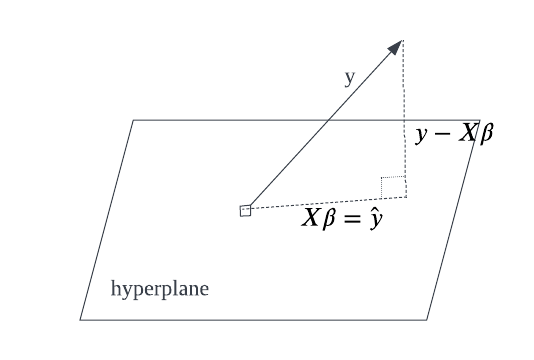
By the definition of orthogonality, we know that
$$ X^T(y-X\beta) = 0 \\ $$and thus $$ \beta = (X^TX)^{-1}X^Ty $$
This is the analytical solution of our linear regression problem.
X = randn(100)
β = 0.2
y = X*β + randn(100)/10
scatter(X, y)

Now we can calculate using the formula
(X'*X)^-1*X'*y
0.19 is really close to 2 (the real $\beta$) ! The same formula hold for higher dimension. We can't visualize it, but we can perform the calculation as usual.
X = randn(100,5)
β = [0.1,0.2,0.3,0.4,0.5]
y = X*β + randn(100)/10

(X'*X)^-1*X'*y
observe that $(0.08, 0.19, 0.32, 0.41, 0.49)$ is really close to $(0.1,0.2,0.3,0.4,0.5)$.